What is Market Structure?

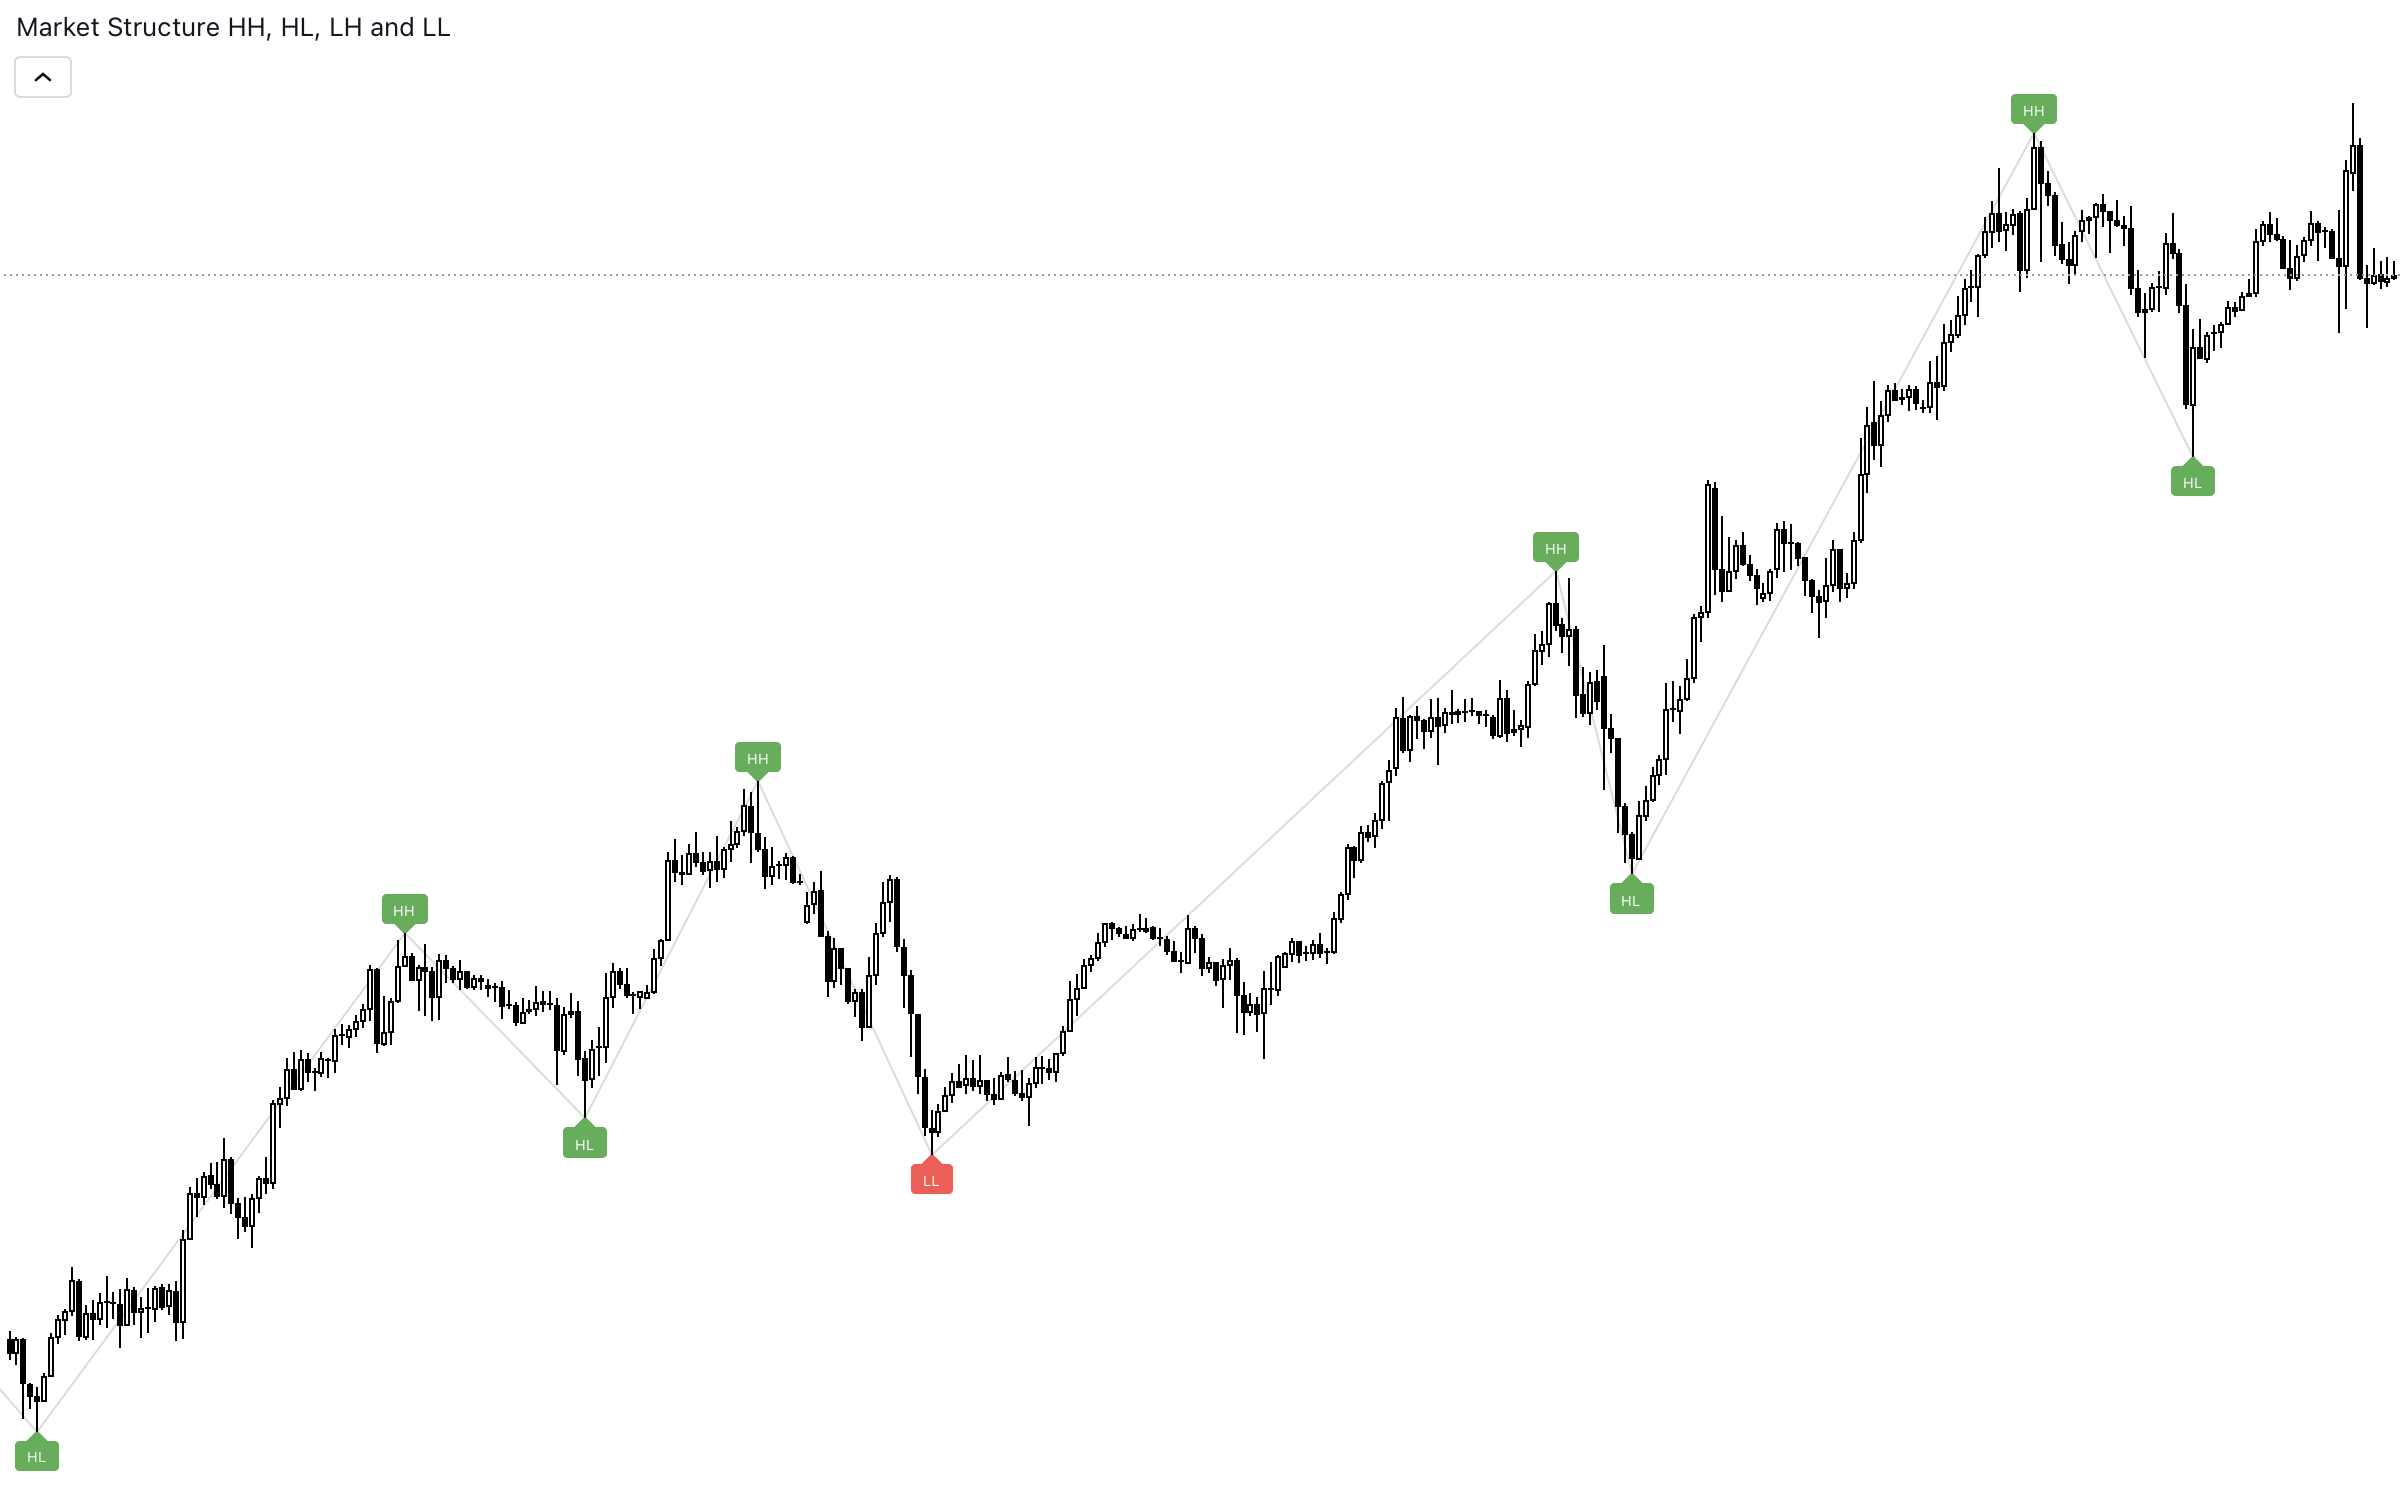
A beginner-friendly introduction to market structure using simple staircase and wave analogies. Explains Higher Highs (HH), Higher Lows (HL), Lower Highs (LH), and Lower Lows (LL), and how these patterns reveal whether the market is moving upward, downward, or staying in a range — without predicting future price.

What Is Market Structure?

A Simple Explanation Using Stairs and Waves**

When traders talk about market structure, they are simply describing how price moves.

It’s not about predicting the future — it’s about reading what the price has already shown us.

To make the idea easy to understand, let’s use two everyday examples:

  • Going up or down a staircase
  • Watching waves rise and fall at the beach

Both examples perfectly explain the four basic elements of structure:

  • HH — Higher High
  • HL — Higher Low
  • LL — Lower Low
  • LH — Lower High

Let’s break it down.

1. Imagine You Are Walking Up a Staircase

When you climb stairs:

  • Every new step you reach is higher than the last one.
  • And every time you place your foot back down, it’s usually not lower than the previous step.

This is the same as an uptrend structure.

Uptrend = Higher Highs + Higher Lows

  • Higher High (HH):
  • Price reaches a new peak that is higher than the previous peak.
  • (Like stepping onto a higher step.)
  • Higher Low (HL):
  • Price pulls back, but the pullback doesn’t drop below the previous low.
  • (Like bringing your foot down to the next higher step.)

When HH and HL repeat, the market is “walking up the stairs.”

It doesn’t have to be fast.

It doesn’t have to be perfect.

But the structure is moving upwards.

2. Now Imagine You Are Going Down the Stairs

When you walk down:

  • Every step is lower than the previous one.
  • Every time you stabilize yourself, you do so on a lower step.

This is a downtrend structure.

Downtrend = Lower Lows + Lower Highs

  • Lower Low (LL):
  • Price falls and creates a new low lower than the previous low.
  • Lower High (LH):
  • Price bounces but fails to reach the previous high.

When LL and LH repeat, the market is “walking down the stairs.”

3. The Beach Wave Example

If stairs describe direction,

waves describe rhythm.

At the beach:

  • Waves push forward → new high point
  • Waves pull back → low point
  • Then another wave pushes forward

Sometimes the next wave reaches further up the sand.

Sometimes it doesn’t reach as far.

This is exactly how price behaves:

If each wave reaches further → Higher High (HH)

If each pullback is still higher than the last → Higher Low (HL)

If waves lose strength → Lower High (LH)

If waves retreat further down → Lower Low (LL)

Waves never move in straight lines,

and price doesn’t either.

4. Why Market Structure Matters

Market structure does not tell you what will happen.

It simply helps you understand what the market is currently doing:

  • Is price stepping upward? (HH/HL)
  • Is price stepping downward? (LL/LH)
  • Or is it stuck in a range with no clear structure?

Understanding this helps you:

  • Read the chart more clearly
  • Recognize changes in momentum
  • Avoid trading against the obvious structure
  • Build a foundation before learning advanced concepts

It’s the “alphabet” of price action.